
__________________________________________________________________________________
See how Stephen made a 108% gain with the Wave Indicator
__________________________________________________________________________________
Tuesday March 4th

__________________________________________________________________________________
“In all institutions from which the cold wind of open criticism is excluded, an innocent corruption begins to grow like a mushroom – for example, in senates and learned societies.”
– Nietszche
__________________________________________________________________________________
Ok ladies and gentleman, a lot to cover in today’s article. Let’s start with the obvious:
The markets are selling off hard.
We’ve blown through all my levels.

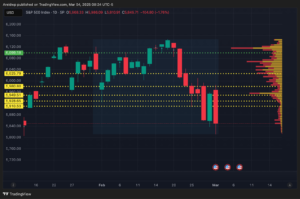
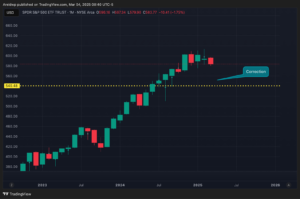
And futures are deep in the red as I write this prior to market open. I want to put the recent drop in perspective. This is the monthly chart for SPY

While people might see a lot of red on the daily or weekly chart and get panicked, these longer term time frames can offer some welcome relief. If I was looking at this pattern on a daily chart, I would be thinking to myself that this is a consolidation pattern before a higher move up. And looking to get in.
That’s not to say that is what’s happening here. As we’ll go into below, there are structural trends that could very well signal a top in the markets. As it stands now, the SPY is in a 3% sell-off. A correction is anything above a 10% drop, but less than 20%.
So, correction = SPY $540
Now, a true bear market would mean the SPY drops 20% or more.
So, bear market = SPY $482
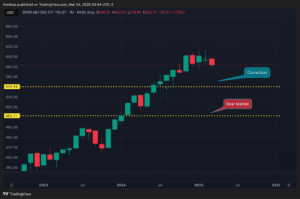
If we do descend into bear market territory, that would put us about where we were exactly one year ago. Which isn’t terrible, if we’re being honest. Sure, your 401(k) would decline a bit, but that wouldn’t be an existential crisis. Now, there’s no guarantee that we won’t fall more than that, but before we even start talking about a bear market, we will have to hit that $482 mark.
But let’s look at what factors are driving this sell-off, and how they might persist into correction zone or bear market territory.
Yen Carry Trade
I’ve talked about this for almost a year at this point. The Yen carry trade is when institutions purchase yield-curve controlled Japanese Yen and then flip those Yen into higher-yielding assets like U.S. bonds and equities. The Yen carry trade is a global liquidity injection machine. However, it depends on the Japanese central bank keeping the Yen yields low.
However, that regime which has persisted for over 20 years is ending.

The Yen is spiking. And the Japanese bank has signaled an unwillingness/inability to keep yields from rising. This will cause a global liquidity drain from the system, which will depress stocks.
Reverse Repo
The repo facility is how the Federal Reserve creates short-term loans to banks in order to foster liquidity in the U.S. banking system. The “reverse” repo facility is when the banks loan their surplus cash to the Fed, which pays the banks a small amount of interest.
Following COVID and the massive stimulus, the banks were flush with excess cash. They in turn parked trillions in capital with the Fed.
However, last night, the Fed just opened up bids into the reverse repo facility. And guess how many banks applied to the reverse repo?
0.
Yep, not a single one. This hasn’t happened since at least the Great Recession. What does it mean? It means that there is basically no liquidity in the banking system. Nada.
The reverse repo facility reached as high as $2 trillion a couple years ago. But as the consumer savings have dwindled and inflation has eaten away at your buying power. I don’t see how banks don’t switch from net lenders to the Fed, to net borrowers from the Fed in the next couple months.
The fact that there were 0 bids for the Fed’s reverse repo means there are NO banks with excess cash. This is crazy.
Yields
Yields are falling. This means current bond buyers believe that we’ve reached the top of the yield curve until the next cycle. This is bearish, because it means that the big players are cycling out of equities into safer, USD bonds. Warren Buffett is holding historic amounts of cash, so this tracks.
Levels For Today

$5858 is the low level. I’m going to be looking for support here today. If we hold, we could see a bounce back to 5910 or so.
But below that, I’ll have to reevaluate.
Lock in traders! Despite the red, things aren’t too bad yet. They might get bad, but we just have to roll with the punches.
____________________________________________________________________________
____________________________________________________________________________
To Better Trading,
Alex Reid