🚨 I’ll be live at 2:30 p.m. ET with Geof Smith🚨
We’ll cover the supply shock fueling urea stocks, the Fed’s high-stakes March dot plot breakdown, and the tactical gamble on Caesars and more [tap to join us for Profit Panel]
One of the cleanest setups I track for reversals isn’t on the daily chart. It’s on the weekly, and today we’ll look at why that matters.
I was walking through this recently with Oklo (OKLO), which is down massively from the highs. On the daily, it looks ugly — no question.
But that’s exactly when I flip to the weekly timeframe, because the story there can be completely different.
Before I even start comparing timeframes, I strip down the chart. I’ll often remove extra indicators so I can focus on the raw price structure.
When you’re analyzing a potential reversal, simplicity helps you see balance, compression or breakdowns that clutter can hide.
Here’s what I’m looking for: Good balance and consolidation at a key moving average on the weekly chart. In OKLO’s case, I used the 100-day moving average (MA) on the weekly because the stock doesn’t have enough history for a proper 200-day MA yet.
That consolidation tells me something important. Despite the brutal drawdown, the stock isn’t in free fall anymore. It’s finding support.
Maybe it’s institutional accumulation. Maybe it’s a floor in selling pressure. Either way, when you combine that technical setup with a real catalyst — like the DOE approval and upcoming earnings — the odds of a reversal start to look a lot better.
Why the Weekly Matters More Than You Think
I recommend this to everyone: You should always check the weekly chart, even when you’re trading off the daily.
The weekly smooths out the noise. It shows you whether a stock is genuinely building a base or just bouncing around in a decline.
And when a stock has been hammered but is holding at a major moving average on the weekly, that’s when reversal setups start to make sense.
I prefer the 200-day MA when the stock has enough history, but the 100-day MA works as a solid proxy when you don’t have the full lookback period.
Risk management also plays a role here. Even if the chart looks great, I’m not taking a position if the cost or timing doesn’t make sense.
With OKLO, the options were expensive and earnings were right around the corner — and I’m not interested in gambling on that.
So instead of forcing a trade, I chose the cheaper leveraged alternative, Defiance Daily Target 2x Long OKLO ETF (OKLL), that still follows the same underlying structure. That’s part of staying disciplined.
How to Use This in Your Own Playbook
Here’s the simple rhythm I follow:
Pull up the daily chart first. If the stock looks beaten down, note the damage and where it’s trading relative to key levels.
Then flip to the weekly. Strip off any extra indicators if needed. Focus on the MA — 100-day or 200-day, whichever you have.
Ask yourself: Is this stock consolidating at that line or is it still sliding? If it’s consolidating with decent balance, that’s your signal that a reversal play might have legs.
Then make sure the setup is clear in your mind. If a part of the structure doesn’t make sense, slow down. Understanding the setup is more important than rushing into a position.
Finally, look for a catalyst. In OKLO’s case, we had earnings coming up, and I expected them to pump the stock on the call.
A technical setup without a fundamental reason is just a chart pattern. You want both.
This multi-timeframe check helps you separate the stocks that are finding real support from the ones that are just catching a bounce on the way down. It’s a simple habit, but it’s one of the cleanest ways I know to spot reversals before the crowd does.
👉 Click here to join Profit Panel at 2:30 p.m. ET on weekdays!
To better trading,
Alex Reid
WealthPin
Follow along and join the conversation for real-time analysis, trade ideas, market insights and more!
- Telegram: https://t.me/+MKMN30kDmVkwMDdh
- YouTube: http://www.youtube.com/@heywealthpin
Important Note: No one from the WealthPin team will ever contact you directly on Telegram.
*This is for informational and educational purposes only. There is inherent risk in trading, so trade at your own risk.
With all the chaos so far in 2026, one highly accurate secret grounded in momentum has called winning market opportunities across different stocks…
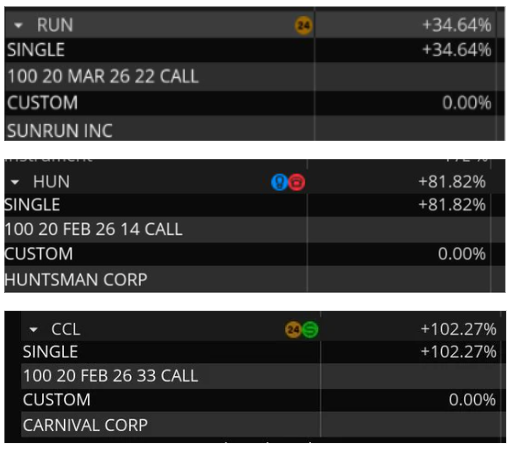
I’m talking about a 34% return on Sunrun (RUN) in four days, 81% on Huntsman (HUN) in a day and even 102% on Carnival (CCL) in five days. And this same secret is flagging an opportunity on the next ticker.
Want the name for free?
Disclaimer: We develop tools and strategies to the best of our ability, but no one can guarantee the future. The profits and performance shown are not typical to any individual; and you may lose money. From 1/15/25 through 2/4/26, the win rate was 83.7%, with an average winner of 43% and an average net return of 16% for winners and losers over a 5-day average hold time.