
Stop Guessing Support and Resistance — Read the Volume Profile

🚨 Profit Panel is live at 9:30 a.m. ET🚨
[tap to join us for Profit Panel]
There’s a tool I lean on when I want to see where price is likely to pause, where it might break out and where it could fall through fast. It’s called an anchored volume profile, and it’s one of the cleanest ways I know to turn a chart into a structural roadmap.
The idea is simple. Instead of looking at volume bars at the bottom of your chart, you’re seeing how much trading happened at each price level on the y-axis. That shift reveals where buyers and sellers were truly active, and once you see it, the structure of the chart becomes obvious.
Volume Shelves vs. Volume Valleys
What stands out immediately are the volume shelves and the volume valleys. Shelves are the thick horizontal blocks where a lot of volume accumulated, while valleys are the thin stretches where almost no trading took place.
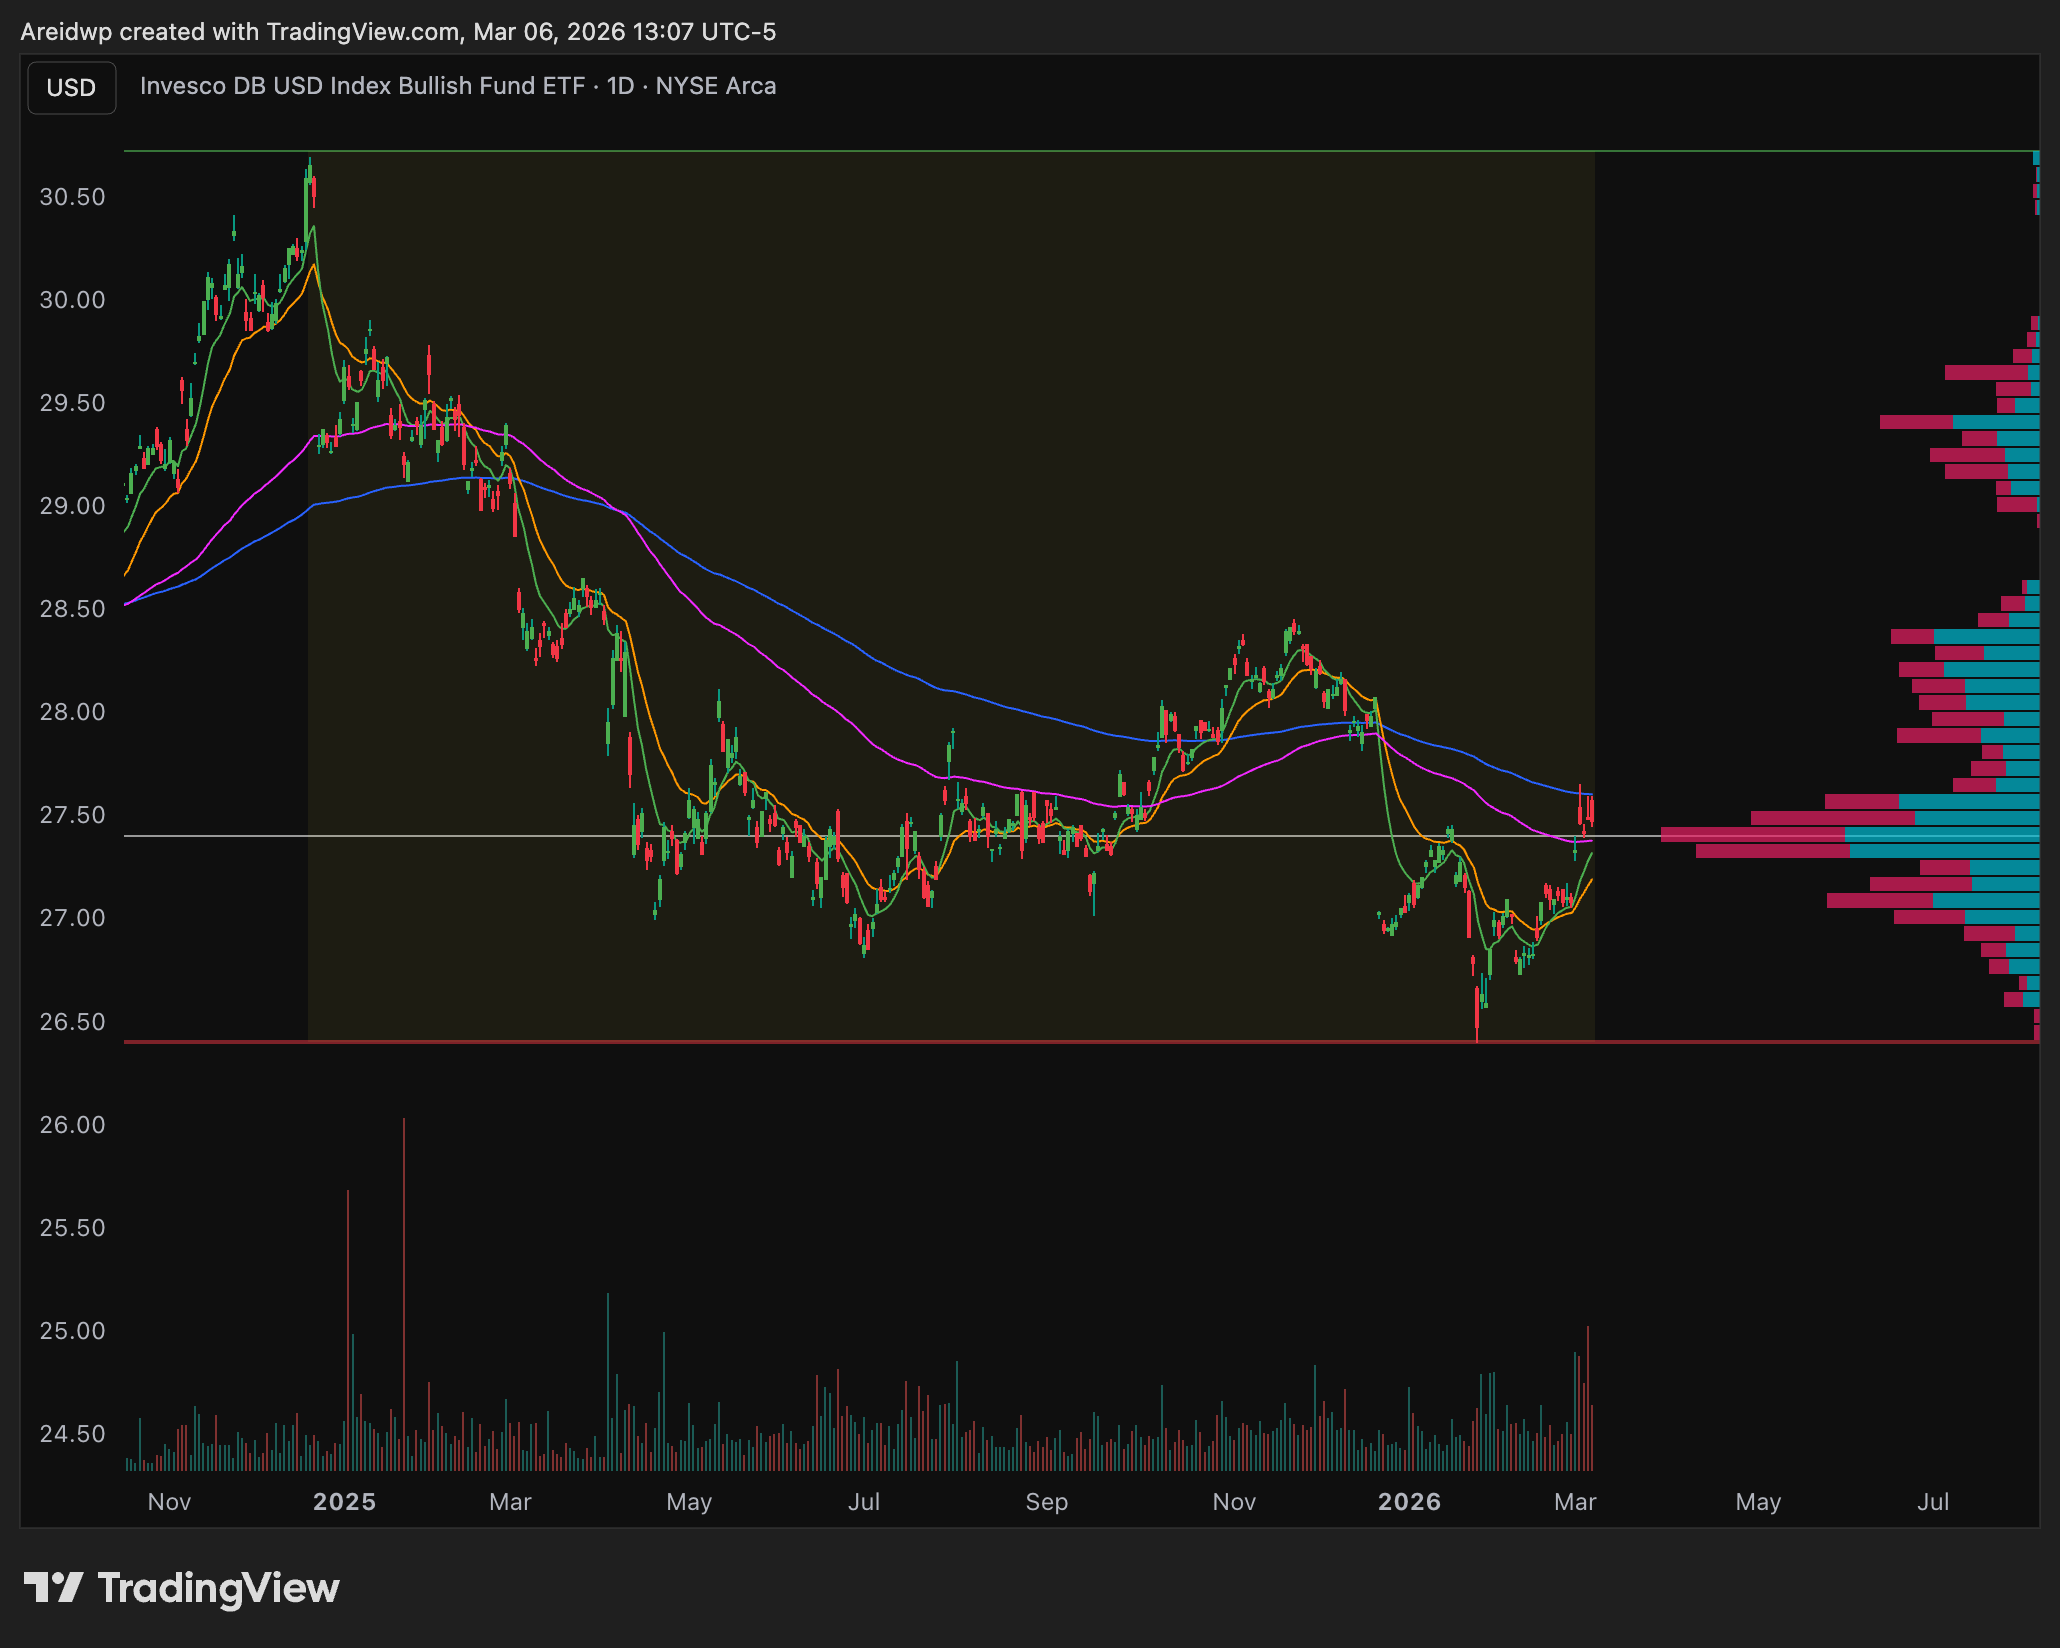
These shelves act like natural support and resistance because that’s where the strongest battles were fought. When price taps a shelf from above, it often finds support, and when it tests from below, it often hits resistance. You see this play out again and again.
How I Used It on UUP
On the Invesco DB US Dollar Index Bullish Fund (UUP) chart, price was coming up to a major volume shelf that lined up with the 200-day moving average around $27.40 to $27.50. That shelf had already caused price to stall and bounce multiple times, which is exactly what I want to see.
When a shelf consistently behaves like that, it confirms the level has real weight. The opposite is true in the valleys — when price breaks over a shelf and steps into a valley, there’s very little structural volume to slow it down.
That’s why moves through valleys tend to be fast. Price often jumps cleanly to the next shelf above. In this case, if UUP cleared that $27.50 zone, the next natural target sat near $27.90 where the next shelf waited.
This also helps on the downside. If price slips below a shelf and falls into a valley, it usually travels quickly until it hits the next cluster of volume below. Understanding this behavior helps you anticipate whether a move is likely to grind or accelerate.
How to Set It Up and the 1 Mistake to Avoid
On TradingView, you can find this under Projection, Volume Base and then Anchored Volume Profile. The key is where you anchor it — you want a clear swing high or swing low so you have structure above and below.
Here’s a step-by-step guide:
-
- Open your chart on TradingView.
- Locate the Left Toolbar: Look for the “Forecasting and Measurement Tools” icon. It usually looks like a “Long Position” icon (a green and red box) or a ruler.
- Click the small arrow next to that icon to open the sub-menu.
- Select “Anchored Volume Profile” near the bottom of that list.
- Place the Anchor: Click on the specific candle where you want the volume calculation to begin (e.g., a swing high, a swing low, or the start of an earnings report).
Anchoring it in the middle of a move gives you incomplete information and can make a shelf look more important than it really is.
I don’t use volume profile on every trade, but when I want clarity on where price is likely to stall or run, it’s one of the most reliable tools I have.
When a shelf lines up with trend, moving averages or other signals, that’s when the setup gets interesting.
To better trading,
Alex Reid
WealthPin
Follow along and join the conversation for real-time analysis, trade ideas, market insights and more!
- Telegram: https://t.me/+MKMN30kDmVkwMDdh
- YouTube: http://www.youtube.com/@heywealthpin
Important Note: No one from the WealthPin team will ever contact you directly on Telegram.
*This is for informational and educational purposes only. There is inherent risk in trading, so trade at your own risk.
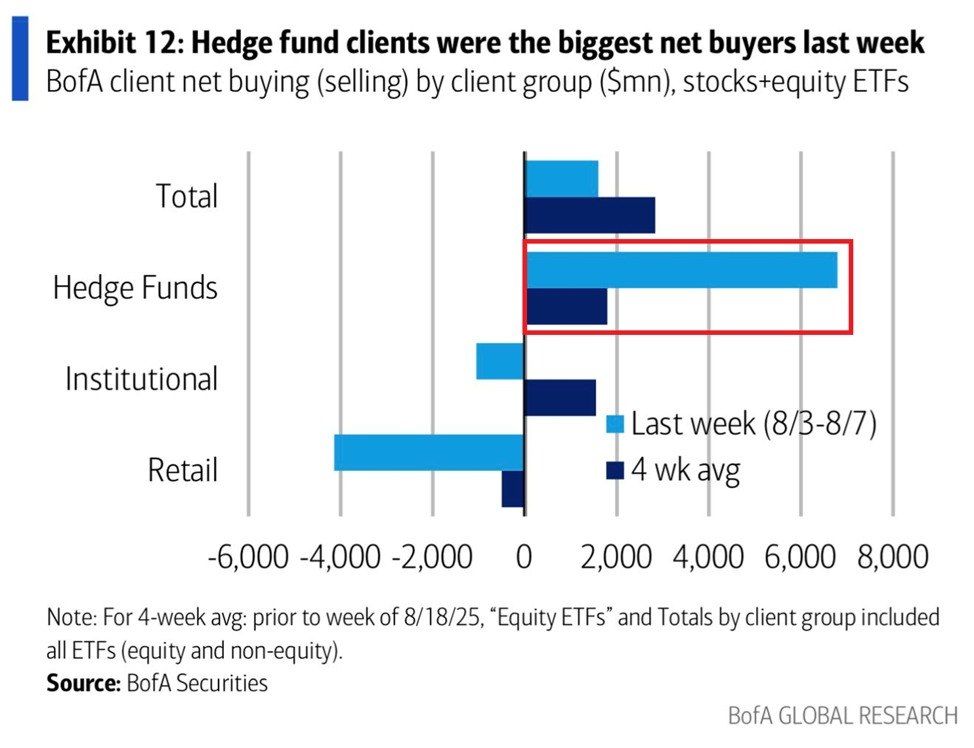
P.S. Hedge Funds Just Made Their Biggest Weekly Buy In 18 Years
See how to track these rotations as they happen in real time
Disclaimer: We develop tools and strategies to the best of our ability, but no one can guarantee the future. Trading always carries a risk of loss. Past Performance is not indicative of future results. What you will see today are some of the best examples from the public trade research service that utilizes this underlying method. From 1/15/25 through 8/17/26, the win rate was 83.1%, with a 39.71% average winner and a 19.52% average net return of winners and losers over a 5-day average hold time.