
The Grinding Decline That’s More Dangerous Than a Flash Crash

🚨 Profit Panel is live at 9:30 a.m. ET🚨
[tap to join us for Profit Panel]
I’ve been tracking something in the market that’s been nagging at me — and I bet it’s been weighing on your radar too.
If you look at recent price action, this current sell-off feels fundamentally different from the fast, sharp pullbacks we saw earlier in the year.
Those moves were violent and dramatic — the kind that spike panic, hit immediate exhaustion and trigger a fast, reflexive bounce.
This decline is far more troublesome. It isn’t a single sharp shock — it’s a relentless, low-volume grind lower, day after day.
Speed matters in how we process risk and execute trades. A violent drop is quick and clean — panic flushes out the weak hands, liquidity clears and the market establishes a temporary floor.
But a slow-bleed decline? It churns lower without offering a clear capitulation point, wearing down trader confidence and bleeding positions by degrees.
The Forces Shaping This Grind
Why does this feel so much heavier? It comes down to market structure and context:
- Deterioration vs. Strength: Earlier pullbacks came off clean breakouts and structural strength, resolving quickly. This slow bleed comes after months of choppiness, compressed momentum and stretched valuations, meaning the market is grinding down from a base of fatigue rather than power.
- Macro Fatigue and Sticky Yields: Higher interest rates alone aren’t the only issue — it’s the lingering reality of sticky inflation and high yields staying elevated for longer. Without a fresh growth narrative to push multiples higher, every uptick in yields exerts direct pressure on equity valuations.
- Persistent Geopolitical Friction: Headwinds from ongoing global instability and energy market uncertainties continue to cap upside attempts. Any attempt at a rally quickly runs out of buying conviction as traders hesitate to hold overnight risk.
Historically, markets can grind upward under high interest rates, but only when strong earnings growth and clear momentum lead the way.
Right now, neither is providing a tailwind.
What This Means for Your Trading
When deciding whether to step in, stay patient or trim risk, the character of a decline matters just as much as the depth of the drop.
- Fast flushes from strong setups often create high-reward reversal entries.
- Grinding declines from weak structures require significantly more technical proof before trusting a bounce.
A single green day or a late-day relief pop isn’t enough to confirm a bottom in a slow-bleed regime. These conditions demand smaller position sizes, tighter exit rules and absolute discipline.
The bottom line: Don’t rush to hero-buy the first sign of green.
With geopolitical headlines keeping markets jumpy and yields setting the tone, wait for structural stabilization — where buyers step in with actual volume and conviction — before expanding your risk.
For now, keep position sizes modest, protect your capital and let the market prove it has found a floor that will actually stick.
To better trading,
Alex Reid
WealthPin
Follow along and join the conversation for real-time analysis, trade ideas, market insights and more!
- Telegram: https://t.me/+MKMN30kDmVkwMDdh
- YouTube: http://www.youtube.com/@heywealthpin
Important Note: No one from the WealthPin team will ever contact you directly on Telegram.
*This is for informational and educational purposes only. There is inherent risk in trading, so trade at your own risk.
P.S. REVEALED: The source of Q4’s most lucrative trade opportunities
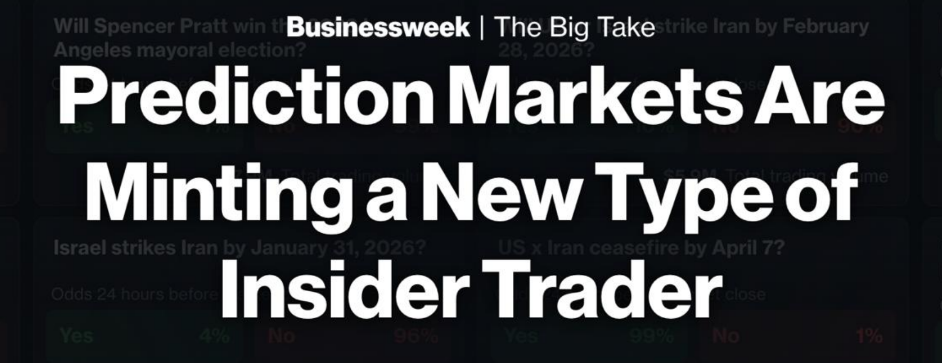
I’ve been tracking an entirely different kind of insider activity that doesn’t take place on the stock, options, or even crypto market.
Yet it’s become a safe haven forward the biggest insiders and is primed to produce the biggest trading opportunities of the next 10 weeks.
Disclaimer: We develop tools and strategies to the best of our ability but no one can guarantee the future. There is always a risk of loss when trading. Past Performance is not indicative of future results. What you will see today are some of the best examples from the public trades that utilizes the Oracle trading tool. From 5/26 through 8/26 the win rate was 85.4% with a 42% average winner and 28% average net return of winners and losers over a 3 day average hold time. Since this is a tool for traders and not a trading service, profits and performance will vary among users.