
How I Spotted the SMR Breakout Before It Ran 5X

🚨 Profit Panel is live at 9:30 a.m. ET🚨
[tap to join us for Profit Panel]
Sometimes the best trades announce themselves early — if you know where to look.
Recently I spotted unusual options activity in NuScale Power (SMR) that turned into a textbook momentum play. The setup was clean, the flow was obvious and the result came fast: Up more than 28% in minutes, before the momentum ultimately drove the contracts to a 5X return.
This is exactly the kind of trade I hunt for every day — where a technical breakout meets real options volume and a 16-cent call can multiply fivefold if you catch it right.
The Opening Setup: Volume, Price Action and a 3% Gap
SMR gapped up 3% in premarket trading. When I pulled up the options chain, the story got interesting fast.
The Sept. 11 $11 calls were trading at 16 cents, then quickly moved to 17 cents as I watched. Good volume was coming in on the call side — not just random retail activity, but real flow.
I also noticed roughly 1,800 put contracts at the $9 strike, with significant open interest and a similar block for the following week.
That pattern suggested someone was running a calendar spread, potentially betting the stock would stay near that level.
Rather than signaling directional fear, the puts appeared more consistent with hedging or income generation.
Meanwhile, the daily chart showed a clear resistance breakout at the open with a gap higher, and the price was holding strong.
The broader market made that relative strength even more important. The S&P 500 (SPY) was not merely down — it was selling off.
When an individual stock holds a breakout while SPY weakens, it tells you buyers are showing unusual conviction.
That divergence can help separate a genuine momentum opportunity from a move driven only by a rising market.
The Trade, the Tools and the Lesson
I flagged the $11 calls live. The move was already underway, so I noted that traders might want to wait for a pullback or flush for a better entry — but the momentum was undeniable.
Those calls gained fivefold. One trader watching with me, Squeezemaster, was up more than 28% within minutes.
This was not luck. It was flow meeting setup. Strong call volume, a resistance breakout, a gap that holds and strength against a falling market all pointed in the same direction.
Predictive analytics can add another layer of context. Oracle tracks prediction-market signals, helping traders monitor shifting expectations alongside options flow and price action.
These signals do not replace the chart or options chain, but they can help confirm when sentiment is changing before the move becomes obvious.
The key is confluence. No single indicator should make the decision for you.
But when options activity, technical structure, relative strength and predictive signals align, you have a much clearer reason to pay attention.
To better trading,
Alex Reid
WealthPin
Follow along and join the conversation for real-time analysis, trade ideas, market insights and more!
- Telegram: https://t.me/+MKMN30kDmVkwMDdh
- YouTube: http://www.youtube.com/@heywealthpin
Important Note: No one from the WealthPin team will ever contact you directly on Telegram.
*This is for informational and educational purposes only. There is inherent risk in trading, so trade at your own risk.
P.S. REVEALED: The source of Q4’s most lucrative trade opportunities
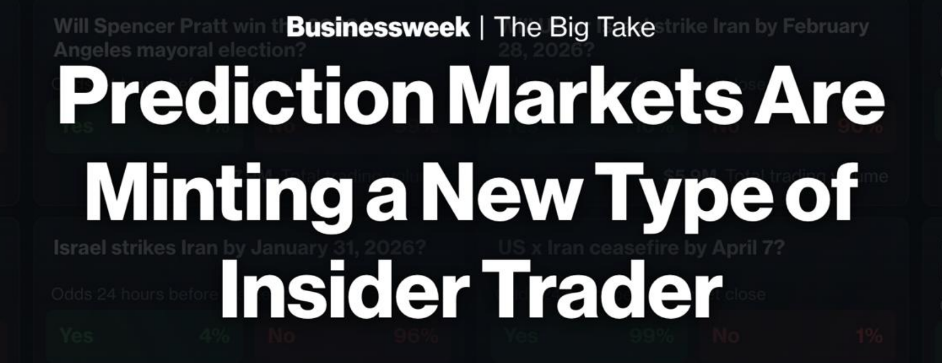
I’ve been tracking an entirely different kind of insider activity that doesn’t take place on the stock, options, or even crypto market.
Yet it’s become a safe haven forward the biggest insiders and is primed to produce the biggest trading opportunities of the next 10 weeks.
Disclaimer: We develop tools and strategies to the best of our ability but no one can guarantee the future. There is always a risk of loss when trading. Past Performance is not indicative of future results. What you will see today are some of the best examples from the public trades that utilizes the Oracle trading tool. From 5/26 through 8/26 the win rate was 85.4% with a 42% average winner and 28% average net return of winners and losers over a 3 day average hold time. Since this is a tool for traders and not a trading service, profits and performance will vary among users.