
How Dealer Inventory Risk Creates Predictable Overnight S&P Moves

🚨 Profit Panel is live at 9:30 a.m. ET🚨
Oil prices and Treasury yields are rising together — bad news for the consumer. We’re breaking down the Fed’s next rate decision and whether the MAG7 continues to serve as a reliable safe haven [tap to join us for Profit Panel]
There’s something happening in markets almost every single day that most traders never connect. You’ll see a sharp overnight move, a gap at the open, and the immediate reaction is to blame headlines, news flow, or sentiment shifts.
But more often than not, the real driver is mechanical.
Wall Street options dealers are constantly adjusting massive positions in the overnight session — not because they want to, but because they have to. That adjustment process is called dealer inventory risk, and once you understand it, these “random” gaps start to look a lot more structured.
How Dealers End Up Moving the Market
When traders buy large amounts of 0DTE options, someone is on the other side of that trade — typically a dealer. The dealer’s job is not to take directional bets. Their job is to stay neutral.
That’s where hedging comes in.
If dealers are net long calls because of customer flow, they have to hedge by buying underlying exposure. If they’re net long puts, they hedge by selling. That hedging pressure is what can quietly influence index direction, especially in the S&P 500.
With today’s volume in 0DTE contracts, those hedging adjustments are no longer small. They can become large enough to impact overnight pricing and set the tone for the next session.
The key is that these adjustments don’t happen randomly. They’re driven by exposure.
If the options market is heavily skewed toward calls heading into expiration, dealers are more likely to be forced into buy-side hedging. If it’s skewed toward puts, the pressure shifts the other way.
These adjustments often happen outside regular trading hours, which is why you’ll sometimes see gaps that seem disconnected from news. The positioning was already there — the adjustment just shows up later.
How Traders Can Use This
The advantage isn’t just knowing direction — it’s understanding the environment you’re trading in. When the S&P is above the “gamma flip” level, dealer hedging tends to act as a buffer. That creates the conditions for slow, steady “grind-up” overnight sessions where dips are absorbed and price drifts higher.
But when price falls below that level, the dynamic can shift quickly. The mechanical flow flips from supportive to reinforcing downside pressure, meaning dealers are forced to sell into weakness.
That’s when a small gap lower can turn into a much larger overnight move, driven less by sentiment and more by hedging flows working in the same direction as price.
When you can read where that imbalance sits in the options market, you’re no longer guessing overnight direction — you’re aligning with the hedging flows that already have to be executed.
That doesn’t mean every move is clean or linear, but it does mean a meaningful portion of overnight price action is structurally driven rather than emotionally driven.
And that’s the edge.
Most traders look for explanations after the move happens. Dealer hedging gives you a framework to understand why the move may have been inevitable in the first place.
Once you start viewing overnight gaps through that lens, the randomness starts to fade — and the structure becomes much easier to see.
To better trading,
Alex Reid
WealthPin
Follow along and join the conversation for real-time analysis, trade ideas, market insights and more!
- Telegram: https://t.me/+MKMN30kDmVkwMDdh
- YouTube: http://www.youtube.com/@heywealthpin
Important Note: No one from the WealthPin team will ever contact you directly on Telegram.
*This is for informational and educational purposes only. There is inherent risk in trading, so trade at your own risk.
P.S. REVEALED: The source of Q4’s most lucrative trade opportunities
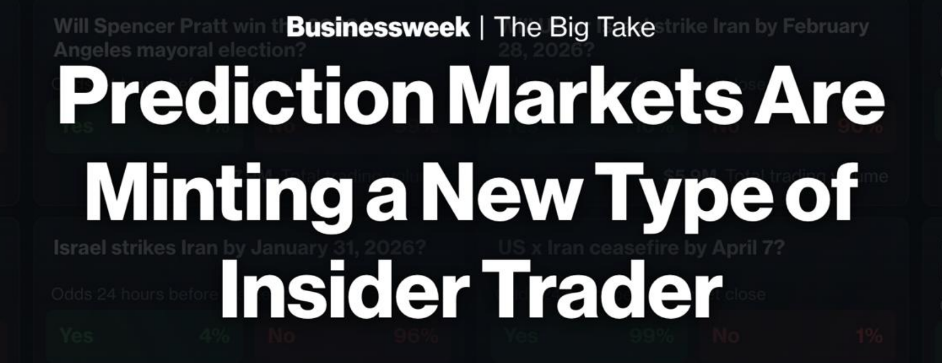
I’ve been tracking an entirely different kind of insider activity that doesn’t take place on the stock, options, or even crypto market.
Yet it’s become a safe haven forward the biggest insiders and is primed to produce the biggest trading opportunities of the next 10 weeks.
Disclaimer: We develop tools and strategies to the best of our ability but no one can guarantee the future. There is always a risk of loss when trading. Past Performance is not indicative of future results. What you will see today are some of the best examples from the public trades that utilizes the Oracle trading tool. From 5/26 through 8/26 the win rate was 85.4% with a 42% average winner and 28% average net return of winners and losers over a 3 day average hold time. Since this is a tool for traders and not a trading service, profits and performance will vary among users.